62 projects on two scoreboards: $173B commitments vs 1.8GW live. We add sanctioned load, headroom, grant disbursal & TTP so your IC sees which GW is actually energizable this fund life. Public-data-only.
Every IC has the same question: "Can this site get 50MW reliably in 24 months at a landed cost we can underwrite?" Gridvik is built to answer that.
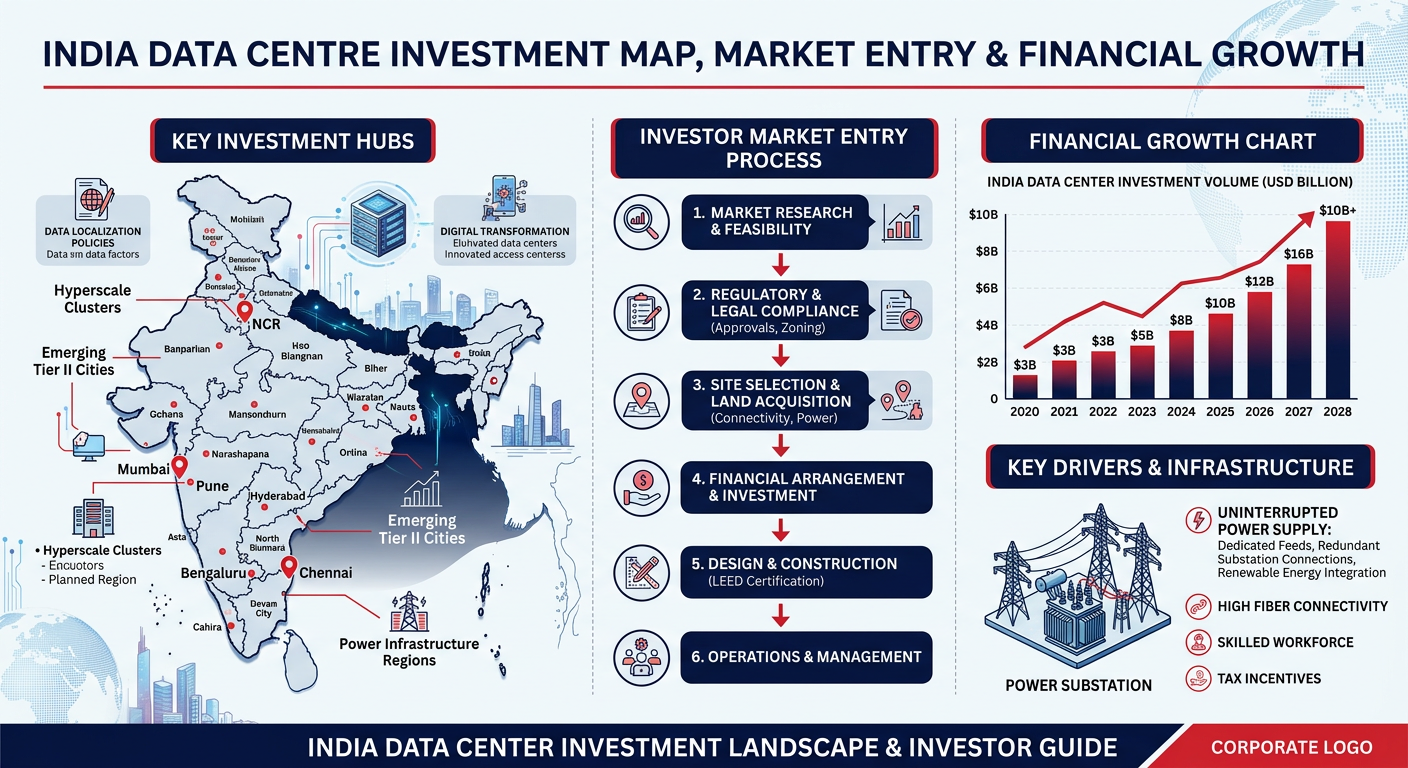
10 states scored in Power Readiness Index v0 (free) — on headroom, TTP, and landed cost, not just policy headlines. See why Vizag, Jamnagar, and Chennai are dispersing from Mumbai.
Download Index v0 →Single-asset or portfolio: land possession, sanctioned load, DISCOM ARR, CTUIL/GNA, grant status — all source-linked. You get a memo you can put in front of a lender.
$173B commitments (press tally) vs 1.8GW live (Savills H1 2026) — we keep them separate. You see which of the 62 is announced, under construction, or live.
Read: Two Scoreboards →Sanctioned load, headroom, grant disbursal, and time-to-power. The only fields you can't scrape from a press release.
DISCOM/CTUIL filings — is 50MW actually sanctioned at that substation?
OK / Constrained / Queue 12–18mo — derived from ARR + filings.
Policy G.O. vs money out — is the incentive actually paid?
Months to energize at that landed cost — not just the MoU date.
Weekly diff: new rows, status changes, policy moves — with source URL + verified_date. Retained change log. No static PDF.
