
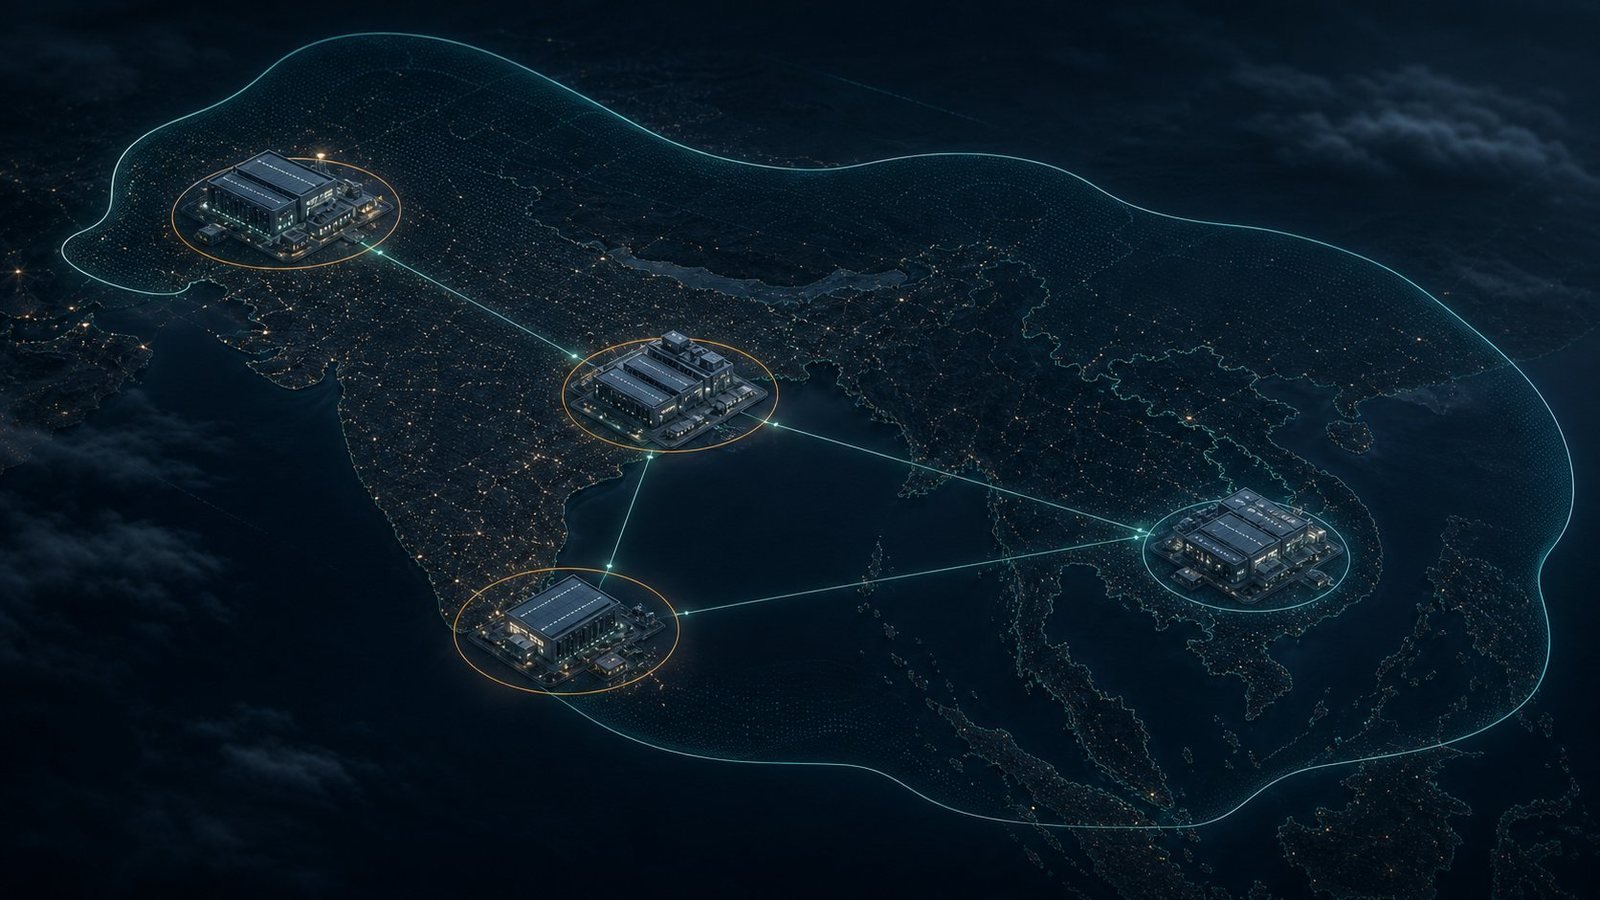
Two examples show potential nesting—not proof that India’s pipeline is actually double-counted by 500MW.
Public-source check through 12 October 2026 (IST). The headline is a question, not a finding that any named company or national market dataset has double-counted capacity.
Short answer: The sources show why a parent total and its phases can be mistaken for separate capacity. They do not establish that India’s national data-centre pipeline contains 500 MW of duplicated projects. The clearest audit arithmetic is 100 MW for PDG’s Mumbai expansion phase + 72 MW for its new Chennai campus = 172 MW—about 170 MW. Those Indian components were announced inside a broader 500 MW, multi-country expansion programme. They are not another 172 MW to add on top of that programme.

First define what “double-counted” would mean
A large total is not double-counted merely because a company has also announced projects that sit within it. The arithmetic error occurs when a parent figure and one or more of its component phases are both entered as independent capacity in the same roll-up, on a comparable basis and for the same period.
A defensible claim of a 500 MW national overcount would therefore need more than two press releases with overlapping-sounding numbers. It would need the actual national inventory, the affected site or phase rows, the capacity basis used for each row, and a reconciliation showing that the same physical MW appears twice in the same total.
This audit tests two public examples for nesting risk. It keeps separate: (1) a company’s total from an incremental phase; (2) India capacity from a regional programme; (3) gross power from IT load; and (4) an announced or planned figure from a commissioned one.
Example 1: PDG’s 500 MW is regional; about 172 MW of named additions are in India
On 19 September 2024, Princeton Digital Group (PDG) said it had acquired powered land for a 500 MW capacity expansion across Mumbai, Chennai, Johor and Jakarta—markets in India, Malaysia and Indonesia. The same announcement identifies two Indian components: a 100 MW expansion phase at the MU1 campus in Mumbai and a new 72 MW CH1 campus in Chennai. Together, those line items equal 172 MW.
That is the “170 MW” audit in the title. It is an arithmetic sum of announced capacity components, not an independently verified amount of commissioned or live capacity. PDG’s release did not label the figures as a common IT-load or gross-power measure, so this article does not convert them into either basis.
| PDG figure (2024 announcement) | What the source says | How to read it |
|---|---|---|
| 500 MW | Powered-land / expansion programme across Mumbai, Chennai, Johor and Jakarta | Regional programme, not 500 MW of India-only capacity and not 500 MW of live supply. |
| 100 MW | First phase of the Mumbai MU1 expansion; the campus is described as reaching 150 MW after the additions | The phase sits within the campus total. Do not add 100 MW to the 150 MW build-out as if both were independent. |
| 72 MW | New CH1 campus in Chennai | An Indian component of the wider regional expansion. |
| ≈172 MW | 100 MW + 72 MW | A useful estimate of the two explicitly stated India additions—not a separate figure to stack on top of the 500 MW programme. |
| 230 MW | PDG’s stated India capacity / footprint after the expansion | A country-level headline, not an additional 230 MW beyond the site additions. The release does not publish a complete site-by-site bridge to this total. |
| 200 MW → 370 MW | Johor capacity addition → stated regional total after expansion | The 200 MW is part of the 370 MW destination figure, not an extra 200 MW on top of it. |
| 100 MW | Jakarta site included in the regional programme | Another named component of the 500 MW programme. |
Two reconciliation gaps are worth preserving rather than quietly “fixing.” First, the four named additions in the PDG announcement—100 + 72 + 200 + 100—sum to 472 MW, not 500 MW. The release does not provide a full project-by-project bridge for the remaining difference; it may reflect rounding or other scope, but the public text does not say. Second, the stated 150 MW MU1 campus + 72 MW CH1 = 222 MW, while the same announcement says PDG’s India footprint will rise to 230 MW. It does not explain the eight-megawatt difference. Neither gap proves an error; both are reasons not to manufacture a precise reconciliation from headline figures.
The geography is the key finding. PDG’s own release says the 500 MW is spread across four locations in three countries. Treating all 500 MW as India’s contribution would be a scope attribution error. Adding the 172 MW Indian additions to the 500 MW regional programme would count components on top of their parent. Adding them again to the 230 MW India headline would also require a project-level bridge to establish whether they are already included and on the same basis.
A later PDG announcement makes the same parent-versus-addition distinction at a different scale and date. On 24 March 2026, PDG said a 210 MW multi-site acquisition in Mumbai and Hyderabad would take its total operating and planned India capacity to 1 GW. The 210 MW is described as an addition to the platform; the 1 GW is the resulting total. Do not add 210 MW to 1 GW, and do not splice this 2026 company total into the 2024 500 MW regional programme without a dated project list. The release says power was secured and key land approvals were in place; it does not say those 210 MW were already operational.

Example 2: CapitaLand’s nearly 500 MW target is an endpoint—not another 500 MW
A second nesting risk appears in CapitaLand’s India data-centre plans, but the labels and entities need care. In September 2024, CapitaLand Investment (CLI) said that, through CapitaLand India Trust (CLINT), it was developing four Indian data centres with a combined 244 MW of gross power capacity. In January 2025, CLINT said its gross power capacity under development was around 250 MW, with about half likely to be pre-leased. Those are closely matched, differently rounded descriptions of a project portfolio—not evidence of two separate 244 MW and 250 MW blocks.
In a November 2025 interview reported by Moneycontrol, CLI India data-centre head Surajit Chatterjee described a goal to nearly double the company’s footprint to about 500 MW by 2028–2030. The same report described roughly 245 MW across four sites and plans to add another 250 MW. The arithmetic is consistent with a total target of roughly 495 MW: an existing/development footprint plus an incremental build-out. It is not evidence for 500 MW on top of the 245 MW or 250 MW figures. An earlier July 2025 Business Standard interview reported a 500 MW total operational target by FY2027–28; the later interview gave a 2028–2030 horizon. These reported dates differ and are not reconciled here.
There is a disclosure limitation: the interview uses “footprint” and “currently developing” for the 245 MW figure, while the 500 MW target is a forward-looking company target. It does not provide a named-site schedule that maps each current phase to the target, nor does it state whether the target is IT load or gross power. The target was reported in an interview, not found as a project-by-project capacity schedule in a primary company filing reviewed for this article. Treat the relationship as a plausible parent/phase overlap that needs a bridge, not as a verified duplicate.
The dated CLINT project record shows why the bridge matters:
- A December 2025 CLI release itemised 200 MW gross power across the Mumbai towers, Chennai and Hyderabad: Tower 1 at 50 MW, Tower 2 at 55 MW, Chennai at 53 MW and Hyderabad at 42 MW. Tower 1 was complete; Tower 2, Chennai and Hyderabad were under development at the time.
- CLINT’s 2026 results later said Navi Mumbai Tower 1’s 50 MW gross had been fully handed over to a hyperscaler. That is a specific delivered phase—not proof that the entire earlier 244–250 MW portfolio was live.
- A transaction announced in December 2025 and reported as completed in February 2026 transferred a 20.2% interest in the same three data-centre projects from CLINT to the CapitaLand India Data Centre Fund. A minority ownership interest does not create a second copy of the buildings or their MW.
- The fourth Bangalore project sits outside the three-project, 200 MW fund portfolio. CLINT’s 2026 results materials describe that 42 MW project as on hold. It should not be silently added to the 200 MW, treated as operational, or assumed to be part of the newer 500 MW goal without a project map.
These figures have different dates and perimeters: 244 MW gross across four developments; around 250 MW gross under development; 200 MW gross across three project locations; one 50 MW gross tower handed over; and a reported company target of nearly 500 MW. A capacity ledger should label each rather than total them. The detailed current stages and ownership distinctions are covered in Gridvik’s India live-status audit.
A market-wide 500 MW forecast is a different kind of number
There is also a widely reported 500 MW national-market figure: CBRE’s India Alternate Sectors Outlook 2026 was reported as forecasting about 500 MW of new data-centre supply in 2026 across major Indian cities. That is a market forecast for supply over a period, not a project-level list, a company’s ultimate campus target, or PDG’s regional powered-land programme. The public CBRE report summary describes large-scale 2026 capacity additions; the exact 500 MW figure is also reported by ET CIO and Business Today as CBRE’s estimate.
For another scale reference, Cushman & Wakefield’s September 2026 H1 update put the development pipeline through 2030 at 3,860 MW: 509 MW under construction and 3,351 MW in planning across its covered markets. That is a multi-year pipeline with status categories, not the same metric as 500 MW of forecast 2026 supply.
These estimates can differ because their cut-off dates, market coverage, supply definitions and project-stage rules differ. A company’s announcement may be included in a consultant’s forecast, but inclusion cannot be assumed—or counted twice—without the relevant project-level methodology. The repeated number “500” is not itself evidence of duplication: the PDG, CapitaLand and CBRE figures have different geographies, time horizons and meanings.
What would prove an actual 500 MW double count?
To substantiate a national overcount, an analyst would need to:
- Obtain the exact national inventory or dataset behind the 500 MW claim and record its cut-off date and coverage.
- Give each campus and phase a unique project identifier, location and owner/operator mapping.
- Record the source’s capacity basis—IT load, gross power, secured utility capacity or design envelope—without mixing them.
- Label each entry as operational, under construction, planned, announced or an ultimate parent/campus target.
- Mark parent–child relationships and show whether phase MW are already included in campus, company or market totals.
- Reconcile ownership changes and fund stakes to physical assets, so a change of investor does not create another copy of the same facility.
- Demonstrate that the duplicated rows are both included in the same national total, then recalculate the overcount after removing the overlap.
Without that bridge, the strongest supportable conclusion is about risk of overlap, not the size of an actual national error.
Verdict: the nesting risk is real; the 500 MW national overcount is not established
The 170 MW audit finds a concrete mechanism: PDG’s 100 MW Mumbai phase and 72 MW Chennai campus sit within a wider, multi-country 500 MW expansion announcement. A second example shows how a company’s nearly 500 MW endpoint can coexist with a roughly 245–250 MW development portfolio and smaller named phases without those numbers automatically adding together.
But the audit does not find project-level evidence that India’s national pipeline is actually double-counted by 500 MW. PDG’s 500 MW is not India-only; CapitaLand’s reported 500 MW is a future target, not an extra 500 MW of commissioned assets; and CBRE’s 500 MW is a market-wide forecast for new supply in 2026. Those are not interchangeable quantities. Until the national dataset is reconciled site by site, “potentially nested” is fair; “500 MW double-counted” is not a verified fact.
Frequently asked questions
Why does the title say 170 MW when the components total 172 MW?
The title uses a rounded shorthand. The two published India components are 100 MW for the MU1 expansion phase and 72 MW for CH1, which total 172 MW exactly. They were announced as future expansion capacity, not as a verified 172 MW of live supply.
Is PDG’s 500 MW expansion an India-only project?
No. PDG’s September 2024 release describes 500 MW across Mumbai, Chennai, Johor and Jakarta, spanning India, Malaysia and Indonesia. The same release identifies 100 MW at MU1 and 72 MW at CH1 as Indian components.
Is CapitaLand’s 500 MW a further addition to its 245 MW pipeline?
The November 2025 interview described a plan to nearly double its footprint to around 500 MW, and reported around 245 MW across four sites plus plans for another 250 MW. That wording points to a roughly 500 MW total endpoint, not 500 MW on top of the existing/development base. The site-by-site bridge and capacity basis were not supplied in the sources reviewed.
Does this show that CBRE’s 2026 500 MW forecast is double-counted?
No. A forecast for new supply across major Indian cities is not the same thing as a roll-up of these named company announcements. A project-level dataset and matching status/basis definitions would be needed to test for duplication.
Method, scope and correction note
This is a desk-based comparison of dated company announcements, investor materials and market-report summaries checked through 12 October 2026 (IST). It is not a site inspection, engineering capacity audit or assurance engagement. Numbers are attributed to their source, stage and stated basis wherever available. The article does not infer that a planned phase was commissioned merely because its target date has passed, and it does not treat gross power and IT load as interchangeable.
The 500 MW double-count phrase is tested as a hypothesis; this draft makes no finding that PDG, CapitaLand, CBRE or a market-data provider intentionally or actually double-counted capacity. Factual corrections—especially a project-level bridge for PDG’s totals, CapitaLand’s 500 MW target and the market-wide forecast methodology—are welcome before publication. No company or executive has been contacted for this draft.
Sources
- Princeton Digital Group, “Expand portfolio by nearly 50 percent with acquisition of 500MW of powered land for AI-ready data centers in Asia,” 19 September 2024 — 500 MW programme geography and named site/phase figures.
- Princeton Digital Group, “Major India expansion taking total capacity to 230 MW in Mumbai and Chennai,” 19 September 2024 — India headline, MU1 phase and CH1 campus.
- Princeton Digital Group, “Acquires 210 MW in India, advancing toward a 1 GW portfolio,” 24 March 2026 — later acquisition and post-acquisition operating/planned total.
- CapitaLand Investment, India data-centre development announcement, 4 September 2024 — CLINT’s four developments and 244 MW gross power.
- CapitaLand India Trust, hyperscaler agreement for a centre under development, 15 January 2025 — around 250 MW gross under development and anticipated pre-leasing.
- CapitaLand Investment, CapitaLand India Data Centre Fund’s 20.2% interests in three data centres, 31 December 2025 — 200 MW gross project table, phase statuses and ownership perimeter.
- CapitaLand India Trust, 1H 2026 results, 29 July 2026 — Tower 1 handover and dated portfolio update; see also the 1H 2026 presentation for project stages.
- Moneycontrol interview with Surajit Chatterjee, 10 November 2025 — reported near-500 MW target and 245 MW / additional-250 MW wording. Interview reporting, not a project-level filing.
- Business Standard interview with Surajit Chatterjee, 15 July 2025 — earlier report of a 500 MW total operational target by FY2027–28 and a 245 MW footprint; the different target horizon is retained as a reported statement, not reconciled here.
- CBRE, India Alternate Sectors Outlook 2026, 18 March 2026 and ET CIO’s report on the 2026 outlook — CBRE’s national market outlook and the reported 500 MW new-supply estimate.
- Cushman & Wakefield, India Data Centre H1 2026 update, 23 September 2026 — 3,860 MW development pipeline through 2030 and status split.
- Uptime Institute, Glossary of Digital Infrastructure Sustainability — terminology context for facility power and IT load.
Continue your Gridvik data-centre research
If you are comparing company announcements with live status, project investment or site milestones, these related Gridvik guides add the next layer:
- India’s data-centre live-status audit: STT GDC, CapitaLand and Keppel — separates operating phases from total portfolio and development figures.
- Google Vizag vs TCS HyperVault: same scale, different milestones — distinguishes a campus ceiling, an announced phase and a construction milestone.
- Singapore 200MW, Jurong 700MW: does capital shift to India? — distinguishes capacity expansion from cross-border investment and proof of capital diversion.
- India Data Centre Investment Map 2026 — maps investor, operator, project and state-level commitments without treating them as interchangeable.
- India’s data-centre expansion, capacity and cities — places project-level plans beside market-wide pipeline estimates.